Logistic Regression Explained
When your outcome is yes/no rather than a number, ordinary regression is the wrong tool. Logistic regression models the probability of a binary outcome—and understanding how to read its results, especially odds ratios, is essential for anyone working with categorical outcomes.
A great many research questions have a yes/no answer. Did the customer churn or not? Did the patient recover? Did the firm default, the student graduate, the applicant get hired? For outcomes like these—binary, categorical—the ordinary linear regression that works so well for continuous outcomes breaks down. Logistic regression is the standard, purpose-built tool for the job, and it is one of the most widely used models across the social sciences, medicine, and business. Using it well means understanding both why linear regression fails here and how to interpret what logistic regression gives back.
This guide explains why a binary outcome needs a different model, what logistic regression does, how to read its coefficients and—crucially—its odds ratios, and the practical cautions to keep in mind. It extends our regression series, building on OLS regression and the choice of statistical method, and reflects the modelling work in our Econometrics & Quantitative Research practice.
Why not just use linear regression?
It is tempting to code the outcome as 0/1 and run an ordinary regression—the so-called linear probability model—and sometimes that is done deliberately. But applied naively, linear regression on a binary outcome has real problems. Because a straight line is unbounded, it can predict probabilities below 0 or above 1, which are nonsensical—a predicted 130% chance of default means nothing. The relationship between a predictor and the probability of an outcome is also rarely linear across its whole range: near-certain outcomes respond little to a change in a predictor, while outcomes near 50% respond a lot. And the assumptions behind ordinary regression—constant error variance in particular—are systematically violated with a binary outcome.
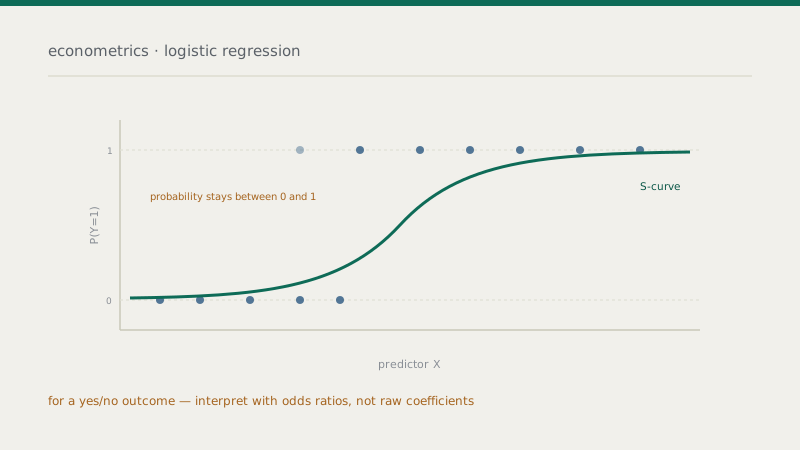
Logistic regression solves all of this by modelling the outcome differently. Instead of forcing a straight line through 0/1 data, it fits an S-shaped (sigmoid) curve that models the probability of the outcome and is mathematically constrained to stay between 0 and 1. The curve is steep in the middle—where a change in the predictor most affects the outcome—and flattens toward the extremes, matching how probabilities actually behave. That bounded, S-shaped form is the essence of what makes logistic regression the right tool for a binary outcome.
Logistic regression models a probability, bounded between 0 and 1. That is why it uses an S-curve rather than a straight line—and why its coefficients are on a scale (log-odds) that needs translating before you interpret them.
How to read the results: odds and odds ratios
Here is where logistic regression trips people up. Its raw coefficients are not on the probability scale and are not directly interpretable the way linear-regression coefficients are—they are expressed in log-odds, which few people can intuit. A positive coefficient means the predictor increases the likelihood of the outcome and a negative one decreases it, but the magnitude in log-odds is not meaningful on its own.
The standard, interpretable quantity is the odds ratio, obtained by exponentiating the coefficient. An odds ratio tells you how the odds of the outcome change for a one-unit increase in the predictor: an odds ratio of 1 means no effect; above 1 means the predictor increases the odds (an odds ratio of 1.5 means the odds are 50% higher per unit); below 1 means it decreases them (0.5 means the odds are halved). This is why logistic-regression results are almost always reported and discussed in terms of odds ratios rather than raw coefficients.
One important subtlety, frequently gotten wrong: an odds ratio is not the same as a relative risk or a change in probability. Odds and probability are related but distinct, and the two diverge—especially when the outcome is common. Saying “the odds are twice as high” is not the same as “twice as likely,” and treating an odds ratio as if it were a risk ratio overstates the effect for common outcomes. For communicating results, many researchers also report predicted probabilities or marginal effects at meaningful values of the predictors, which are often more intuitive for a general audience than odds ratios.
Beyond the binary case
Logistic regression extends naturally beyond simple yes/no outcomes. When the outcome has more than two unordered categories—choosing among several brands, say—multinomial logistic regression applies. When the categories are ordered—a satisfaction rating from low to high—ordinal logistic regression is appropriate and respects the ordering. The same underlying logic—modelling probabilities with a suitable link function rather than forcing a linear fit—carries through, and choosing the right variant for the structure of your outcome is part of using the method correctly.
Practical cautions
A few practical points separate a sound logistic regression from a shaky one. It needs an adequate sample size, and in particular enough cases in the less common outcome category—a model predicting a rare event needs enough of those rare events to estimate reliably, regardless of the total sample. Like any regression, it assumes the model is correctly specified and, for causal claims, faces the same endogeneity concerns as linear regression—logistic regression is not a shortcut around confounding. Multicollinearity, separation (where a predictor perfectly predicts the outcome), and influential outliers all warrant the usual diagnostic attention. And model fit is assessed differently than in linear regression—there is no ordinary R-squared—so appropriate measures of fit and classification performance should be reported.
The bottom line
When your outcome is binary, logistic regression—not linear regression—is the right tool: it models the probability of the outcome with an S-shaped curve bounded between 0 and 1, avoiding the impossible predictions and violated assumptions that plague a linear fit. Its coefficients live on the log-odds scale, so interpret them through odds ratios (exponentiated coefficients), remembering that an odds ratio is not a risk ratio or a probability change—and consider reporting predicted probabilities for clarity. Choose multinomial or ordinal variants when the outcome has more categories, and give the model the same diagnostic care, sample-size attention, and causal caution as any regression. Handled this way, logistic regression turns a yes/no question into a rigorous, interpretable model.
Frequently asked questions
Working with a binary or categorical outcome?
From choosing between logistic, multinomial, and ordinal models to interpreting odds ratios and marginal effects correctly, our team can help you model categorical outcomes to a defensible standard.