How to Choose the Right Statistical Method for Your Research Question
The method is not a technicality you settle at the end—it is a decision that determines what your study can credibly claim. This guide gives you a practical framework for matching a statistical method to your research question, your data, and your field's expectations, so the analysis you run is the one your question actually needs.
Ask an experienced methodologist how to choose a statistical method and you will rarely get a technique as the first answer. You will get questions. What exactly are you trying to find out? What does your data look like? What will a reviewer in your field expect to see? The choice of method is one of the most consequential decisions in the whole research process, and it is made far too often by habit—the technique the researcher already knows, or the one a supervisor happens to favour—rather than by fit. A strong question paired with the wrong method produces a study that either cannot be defended or answers a question nobody asked.
This article lays out the way we approach method selection at MAS Research: a structured sequence of decisions that narrows the field of appropriate methods before any software is opened. It is deliberately not a lookup table of “if X, run Y,” because those tables encourage exactly the mechanical thinking that leads to indefensible analysis. Instead, it is a way of reasoning that you can apply to your own project. If you would like the underlying capability behind this reasoning, our Research Methods practice sits across the whole toolkit; this guide is the thinking that decides which part of it your study needs.
Start with the claim, not the technique
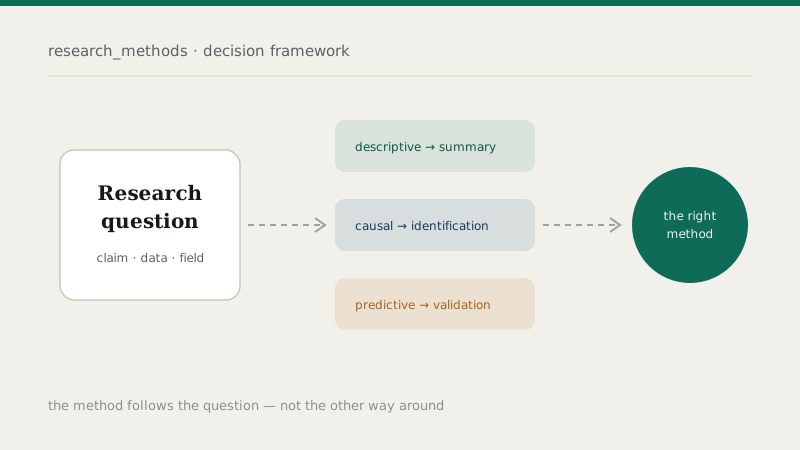
The first and most important question is what kind of claim your study wants to make. This sounds abstract, but it is the single decision that rules the most methods in or out, and getting it wrong is behind a large share of avoidable rejections. There are three broad kinds of claim, and they call for genuinely different tools.
A descriptive claim asks what the pattern is: how something is distributed, how it has changed over time, how cases cluster, how variables move together. A causal claim asks whether one thing actually produced a change in another—whether a policy raised employment, whether a training programme improved performance. A predictive claim asks what will happen next, or what an unobserved value is likely to be, without necessarily explaining why. These are not interchangeable. A model built to predict an outcome accurately is often a poor tool for estimating a causal effect, and a model built to isolate a causal effect is usually a mediocre forecaster. Confusing prediction with causation—treating a strong correlation as evidence that one thing drives another—is the most common and most costly error in applied quantitative work.
Settle the nature of the claim first, because everything downstream depends on it. If your question is causal, your attention turns immediately to identification—the design and assumptions that let a coefficient be read as an effect rather than an association—which is the heart of our Causal Inference & Policy Evaluation work. If your question is predictive, your attention turns to out-of-sample performance and the risk of overfitting. If it is descriptive, your attention turns to measurement and to representing the pattern honestly. Naming the claim is how you avoid running a sophisticated analysis that answers the wrong question beautifully.
Then examine the structure of your data
Once the claim is clear, the structure of your data narrows the field further. Several features matter, and each rules some methods in and others out.
The first is the shape of the dataset over units and time. A single snapshot across many cases—firms, people, countries—is a cross-section. The same unit tracked repeatedly over time is a time series. Many units each observed over several periods form a panel, and panels open up methods that neither pure cross-sections nor pure time series allow, because they let you separate stable differences between units from changes within them. If your data is a panel, analysing it as though it were a simple cross-section throws away its greatest advantage and usually produces standard errors that are quietly wrong. This is the territory of our Longitudinal, Panel & Multilevel Research practice, and it is where the fixed-effects-versus-random-effects question lives.
The second feature is the nature of the outcome variable. Is it continuous, like revenue or a test score? Binary, like whether a firm defaulted? A count, like the number of patents? A category with no natural order, or one with a clear ranking? A duration until an event occurs? Each of these outcome types has methods built for it, and applying an ordinary linear model to a binary or count outcome, while common, can produce nonsensical predictions and misleading inference.
The third feature is dependence between observations. Standard methods assume observations are independent, but real data is often nested—students within schools, employees within firms, repeated measures within the same person. When observations cluster like this, ignoring the structure understates uncertainty and overstates significance. Multilevel and clustered approaches exist precisely for this, and recognising the nesting is what tells you that you need them.
A short worked distinction makes the point. Suppose you are studying whether a management intervention improved firm performance, and you have several years of data on many firms. The claim is causal; the data is a panel; the outcome is continuous. That combination already points you away from a naive pooled regression and toward a design that exploits the panel structure and takes identification seriously—perhaps a difference-in-differences design if the intervention rolled out at different times. Change any one of those three facts—make it a single year, or a binary outcome, or a predictive rather than causal question—and the appropriate method changes with it.
Account for what your field expects
Methods have conventions, and those conventions move. A technique that was standard practice a few years ago can now draw a rejection, because the field's understanding of its weaknesses has advanced. Reviewers in economics, finance, and management increasingly expect identification assumptions to be tested rather than asserted, robustness to alternative specifications to be shown rather than promised, and the limitations of the data to be confronted rather than buried. A methodologically sound analysis that is written in the register your field no longer accepts will still struggle in review.
This is the part of method selection that is hardest to get right from outside an active research life, because it depends on knowing the current conversation in your specific discipline—what a good referee will look for, which older approaches now attract objections, and how results are expected to be reported. It is a large part of what specialist support adds, and it is why matching a method to a field is as important as matching it to the data. When the stakes are high, an independent statistical and methodological audit before submission catches the objections a reviewer would raise while you can still act on them.
A practical sequence you can follow
Pulling the three considerations together gives a repeatable sequence. It will not choose the method for you—no honest framework can, because judgement is irreducible—but it will narrow the field to a small, defensible set and make your reasoning explicit enough to defend.
- Name the claim. Write, in one sentence, whether you are describing a pattern, estimating a causal effect, or predicting an outcome. This alone eliminates most methods.
- Characterise the data. State the structure (cross-section, time series, or panel), the outcome type (continuous, binary, count, categorical, duration), and any nesting or clustering.
- Match candidates to both. List the two or three methods that fit the claim and the data together. If a method fits the data but not the claim—or the claim but not the data—set it aside.
- Check field expectations. For each candidate, ask what a current reviewer in your discipline will expect, and whether the method is still considered appropriate for this use.
- Plan the diagnostics. Decide, before you run anything, which assumptions each candidate rests on and how you will test them. A method is only as credible as the checks that accompany it.
- Document the reasoning. Record why you chose what you chose. That record becomes your methods section and your defence in review.
Notice that the technique is chosen at step three, not step one. That ordering is the whole point: the method follows the question and the data, rather than the question being bent to fit a familiar method.
Where the common method families fit
It helps to see how the major families map onto this framework, without treating the mapping as a substitute for judgement. When the claim is about relationships in cross-sectional or panel data and identification is manageable, regression-based econometric methods are the workhorse—provided their assumptions are tested rather than assumed. When the claim is causal and you have a design that creates credible variation in the treatment, the causal-inference toolkit—difference-in-differences, regression discontinuity, instrumental variables, matching—is what makes the effect defensible. When your interest is in latent constructs measured through multiple indicators, such as attitudes or capabilities, structural equation modelling and psychometrics let you model measurement and structure together, provided the measurement is validated first. And when your question is to synthesise what many existing studies collectively show, meta-analysis and evidence synthesis is the appropriate tool rather than any single primary analysis.
Two further principles cut across all of these. First, measurement precedes modelling: a sophisticated model built on a poorly measured variable is a sophisticated way of being wrong. Second, no analysis is complete without diagnostics—the tests that check whether the assumptions your method depends on actually hold in your data. The difference between an analysis that merely runs and one that persuades is almost always in these details, not in the headline result.
When to bring in specialist support
Much of method selection is learnable, and a careful researcher working through the sequence above will make sound choices most of the time. There are, though, points where specialist input earns its place: when the claim is causal and identification is genuinely difficult; when the data structure is complex enough that the standard approaches do not obviously apply; when the method you learned has since been revised in ways your field now expects; or simply when the stakes—a thesis defence, a submission to a strong journal, a grant—justify a second, expert view before you commit. Our support for researchers and PhD scholars is built around exactly these moments: not to run your analysis for you, but to make sure the method you choose is the one your question deserves, and that you can defend it as your own.
The method is a decision, not a default. Made deliberately—claim first, then data, then field—it is the decision that gives your research its best chance of holding up, both under review and in the years after.
Frequently asked questions
Not sure which method fits your question and data?
Our methodology team can help you match your research question to the right approach—and make sure you can defend it. Explore our Research Methods capability, or tell us about your study.