Multilevel Models Explained: When Your Data Has Structure
When your data is nested—students within schools, employees within firms, repeated measures within people—treating every observation as independent gets the statistics wrong. Multilevel models respect that structure, and knowing when you need one is essential for a large class of research.
A great deal of real-world data is not a flat list of independent observations—it is nested. Students are grouped within schools, employees within firms, patients within hospitals, repeated measurements within individuals. This nesting is not a nuisance to be ignored; it is a structural feature of the data with real statistical consequences. Analyse nested data as if every observation were independent and you will get standard errors that are wrong and conclusions that may not hold. Multilevel models—also called hierarchical linear models or mixed-effects models—are built precisely to handle this structure, and recognising when your data calls for one is a fundamental methodological skill.
This guide explains what nested data is, why ignoring the structure causes problems, what multilevel models do about it, and when you need one. It extends our guide to panel vs cross-sectional data and fixed vs random effects, and reflects the work of our Longitudinal, Panel & Multilevel Research practice.
What nested data is
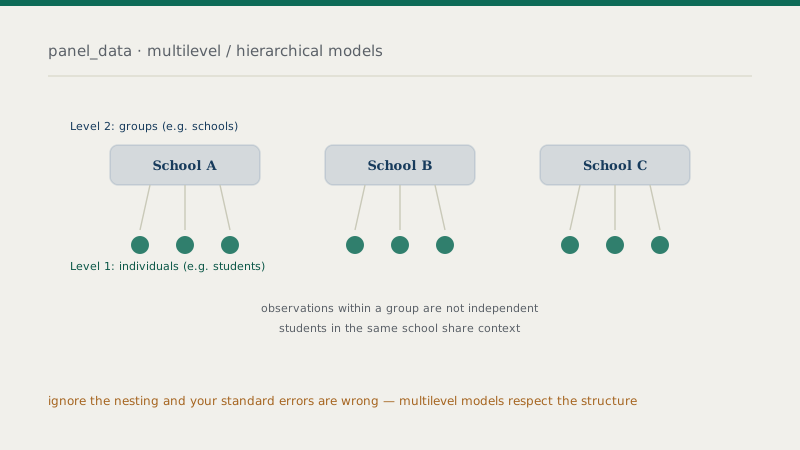
Data is nested (or hierarchical) when observations at one level are grouped within units at a higher level. The classic example has two levels: individual students (level 1) grouped within schools (level 2). Repeated-measures data is nested too—multiple observations over time (level 1) within each person (level 2)—which is why panel and longitudinal data are, in effect, multilevel data. Structures can go deeper: students within classrooms within schools within districts, giving three or four levels.
The defining feature of nested data is that observations within the same group are not independent of one another. Students in the same school share teachers, resources, catchment, and culture, so their outcomes are more similar to each other than to students in other schools. This dependence—quantified by the intraclass correlation, the share of variation that lies between groups rather than within them—is the whole reason nested data needs special treatment. When observations cluster, the assumption of independence that ordinary regression relies on is violated.
Why ignoring the structure is a problem
Suppose you ignore the nesting and run an ordinary regression on all observations pooled together. The most immediate consequence is that your standard errors are wrong—typically too small, because you are treating correlated observations as if they carried more independent information than they really do. Too-small standard errors mean p-values that are too small and confidence intervals that are too narrow, so you will find “significant” effects that are not real. This is the same class of problem as clustering more generally: dependence you fail to account for inflates apparent precision.
There is also a conceptual cost. Pooling everything ignores that groups may genuinely differ, and it can even reverse relationships—a pattern that holds within groups can look different when groups are lumped together. The opposite mistake, analysing each group separately, throws away the shared information and leaves you with unstable estimates from small per-group samples. Neither extreme—total pooling nor no pooling—is right, and that is exactly the gap multilevel models fill.
Nesting means observations aren’t independent—and independence is what ordinary regression assumes. Ignore the clustering and your standard errors shrink artificially, manufacturing significance that will not replicate.
What multilevel models do
A multilevel model accounts for the nested structure directly by allowing effects to vary across groups and by partitioning the variation into its levels. Two ideas are central. The first is random intercepts: instead of forcing every group to share one baseline, the model lets each group have its own intercept, capturing that some schools simply have higher average outcomes than others. The second is random slopes: the model can also let the effect of a predictor differ across groups—perhaps class size matters more in some schools than others. Together these let the model represent both how groups differ and how relationships play out within them.
A particularly valuable property is partial pooling (or “shrinkage”). Rather than pooling all groups completely or estimating each in isolation, a multilevel model borrows strength across groups: estimates for groups with little data are pulled toward the overall average, while groups with plenty of data keep estimates close to their own. This produces more stable, sensible estimates than either extreme, and it is one of the main reasons multilevel models are so useful when some groups are small. The model also lets you include predictors at each level—student-level characteristics and school-level characteristics in the same model—and to ask how much of the outcome variation lies between groups versus within them.
When you need a multilevel model
The trigger is structural, not statistical: if your data is nested—observations grouped within higher-level units—and you have reason to think the grouping matters, you should be using a method that accounts for it. Common cases include individuals within organisations, repeated measures within subjects (longitudinal/growth data), pupils within schools, and any situation where a clustering variable induces dependence. If your research question spans levels—does a school-level policy affect student-level outcomes?—a multilevel model is often the natural and correct tool, because it can include predictors at both levels simultaneously.
It is worth noting that multilevel modelling is closely related to other approaches to clustered data. Fixed-effects models and cluster-robust standard errors also address non-independence, and the right choice among them depends on your question—particularly whether you want to model the between-group variation and include group-level predictors (favouring multilevel/random-effects approaches) or simply guard against the confounding of stable group differences (often favouring fixed effects). They are tools for related problems, and choosing well requires being clear about what you want to learn.
Practical considerations
A few cautions matter in practice. Multilevel models need an adequate number of groups, not just an adequate total sample—estimating between-group variation reliably requires enough groups at the higher level, and too few can make the variance components unstable. Decisions about which effects to allow to vary (random intercepts only, or random slopes too) should be guided by theory and checked, since over-complex random-effects structures can fail to estimate. And, as always, a multilevel model addresses the dependence structure of the data; it does not by itself resolve endogeneity or licence causal claims without an appropriate design. Used for the right data, though, it turns a structural feature that would otherwise distort your results into information the model uses properly.
The bottom line
When observations are nested—within schools, firms, hospitals, or repeated within individuals—they are not independent, and analysing them as if they were produces standard errors that are too small and findings that will not hold. Multilevel models respect the structure: they let intercepts and slopes vary across groups, partition variation into its levels, borrow strength across groups through partial pooling, and accommodate predictors at every level. Reach for one whenever your data has a genuine grouping structure that matters, ensure you have enough groups, choose the random-effects structure thoughtfully, and remember it handles dependence, not causation. Match the model to the structure of your data, and nested data becomes a strength rather than a trap.
Frequently asked questions
Data with a grouping structure?
From random-intercept and random-slope models to growth curves and cross-classified structures, our team can build the multilevel model your nested data actually requires.