Panel Data vs Cross-Sectional Data: What’s the Difference?
The structure of your data determines what questions you can answer and which methods you can use. Understanding the difference between cross-sectional, time-series, and panel data—and why panel data is so powerful—is fundamental to sound empirical research.
Before you choose a method, you have to understand the shape of your data—because data structure, more than almost anything else, dictates what you can credibly conclude. A dataset of many firms in a single year, a dataset tracking one country’s GDP over decades, and a dataset following the same firms across many years are three fundamentally different things, and each supports a different kind of analysis. Confusing them, or failing to exploit the structure you have, is behind a surprising share of weak empirical work.
This guide explains the three main data structures—cross-sectional, time-series, and panel—and why panel data in particular opens up analytical possibilities the others cannot. It is a foundation for our Longitudinal, Panel & Multilevel Research practice, and it sits directly beneath our guide to fixed effects vs random effects, a choice that only exists because of what panel data makes possible.
The three data structures
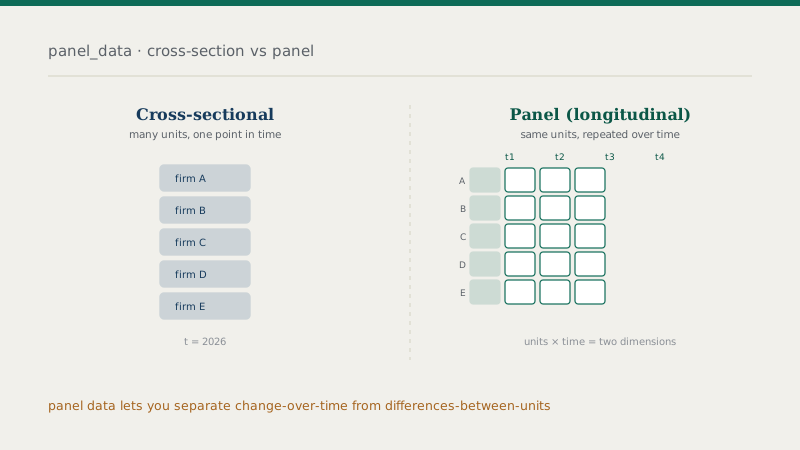
Cross-sectional data captures many units—individuals, firms, countries—at a single point in time. A survey of 500 companies conducted this year is cross-sectional: lots of units, one time period. It is excellent for comparing units to one another and describing a population at a moment, but it can say nothing about how things change over time, because it contains only one moment.
Time-series data is the mirror image: a single unit observed repeatedly over many time periods. A country’s quarterly GDP over thirty years is time-series data—one unit, many moments. It is built for studying dynamics, trends, and forecasting, but it describes only that one unit, so it cannot compare across units, and it brings its own complications such as stationarity.
Panel data (also called longitudinal data) combines both: many units, each observed over multiple time periods. A dataset following the same 500 firms across ten years is panel data—it has both a cross-sectional dimension (the firms) and a time dimension (the years). This two-dimensional structure is what gives panel data its distinctive power, because it lets you look at both how units differ from each other and how each unit changes over time.
The one-line distinction: cross-sectional = many units, one time; time-series = one unit, many times; panel = many units, many times. The last combines the strengths of the first two—and adds abilities neither has alone.
Why panel data is so powerful
Panel data’s two dimensions are not merely convenient—they change what you can identify. The central advantage is the ability to control for unobserved, time-invariant characteristics of each unit. Every firm, person, or country has stable traits you cannot measure—a firm’s management culture, a person’s innate ability, a country’s institutional history—and in cross-sectional data these unmeasured traits sit in the error term, where they can bias your estimates if they correlate with your predictors.
Because panel data observes each unit more than once, it can compare a unit to itself over time. Anything about that unit that stays constant—observed or not—can be differenced away, removing its confounding influence entirely, without your ever having to measure it. This is the engine behind fixed-effects models, and it is why panel data supports far more credible causal claims than a single cross-section can. It also lets you separate two kinds of variation: within-unit variation (how a unit changes over time) and between-unit variation (how units differ on average)—a distinction that is invisible in cross-sectional data but central to panel analysis.
There are practical benefits too: panel data typically offers more observations and more variation than a single cross-section, improving the precision of estimates, and it allows the study of dynamics—how past values influence present outcomes—that pure cross-sections cannot address.
What each structure lets you ask
The structures map onto different questions. Use cross-sectional data to compare units and describe a population at a point in time—how firms of different sizes differ today, for instance. Use time-series data to study how a single unit evolves, to identify trends, and to forecast—where a market is heading, say. Use panel data when you want to explain how outcomes change over time while accounting for stable differences between units, or when you need the stronger identification that comparing units to themselves provides. Many of the most credible empirical questions—did this policy change firm behaviour, does this factor drive that outcome once fixed differences are removed—are panel questions.
The trade-offs and cautions
Panel data is powerful but not free of complications. It is harder and more expensive to collect, since it requires following the same units over time, and it suffers from attrition—units dropping out of the sample—which can bias results if those who leave differ systematically from those who stay. Panel data also requires methods suited to its structure: analysing it with ordinary techniques that ignore the repeated observations produces incorrect standard errors and forfeits the very advantages that make panel data worth having. The choice between fixed and random effects, and the handling of dynamics and nesting, all follow from taking the structure seriously.
The practical lesson is simple: identify your data structure before you choose a method, and if you have panel data, use methods built for it. The structure is not a technical footnote—it is the foundation that determines which questions are answerable and how credibly. Recognising what you have, and matching your analysis to it, is one of the most consequential early decisions in any empirical project.
Frequently asked questions
Have panel data to make the most of?
From exploiting the within-unit variation to choosing fixed, random, dynamic, or multilevel models, our team can help you get the full value from data observed over time.