Publication Bias and the Funnel Plot
If studies with striking results are more likely to be published than those with null findings, the published literature is a biased sample—and any meta-analysis built on it overstates the effect. This guide explains publication bias, how the funnel plot helps detect it, and what to do about it.
A meta-analysis is only as trustworthy as the studies it pools—and it can only pool the studies it can find. That is a deceptively serious problem, because the studies that make it into the published literature are not a random sample of the studies that were conducted. Research with statistically significant, striking results tends to get published; research with null or unremarkable findings tends to sit in a file drawer, rejected or never submitted. When a meta-analysis then synthesises what is published, it synthesises a skewed sample—and its pooled estimate is inflated. Publication bias is one of the most important threats to the validity of evidence synthesis, and every serious meta-analysis has to confront it.
This guide explains what publication bias is, why it distorts meta-analytic results, how the funnel plot and related tools help detect it, and the limits of what any detection method can do. It deepens our guides to conducting a systematic review and meta-analysis and heterogeneity, and reflects the synthesis practice in our Meta-Analysis & Evidence Synthesis work.
What publication bias is
Publication bias is the tendency for the publication of a study to depend on the nature of its results—specifically, for statistically significant or positive findings to be more likely to appear in the literature than null or negative ones. It is sometimes called the “file-drawer problem,” evoking the null-result studies that never leave the researcher’s file drawer. The bias operates through several channels: authors may not bother submitting null results, reviewers and editors may favour significant ones, and studies with striking findings get cited and republished more.
The consequence for meta-analysis is direct and serious. A meta-analysis aims to estimate the true average effect by combining all the evidence—but if the small, null-result studies are systematically missing, the sample it draws from is tilted toward larger, positive effects. The pooled estimate is therefore biased upward: it overstates how strong the effect really is, and in the worst case can suggest a robust effect where the full body of evidence would show little or none. This is not a subtle statistical quibble; it can change the headline conclusion of a synthesis.
The funnel plot
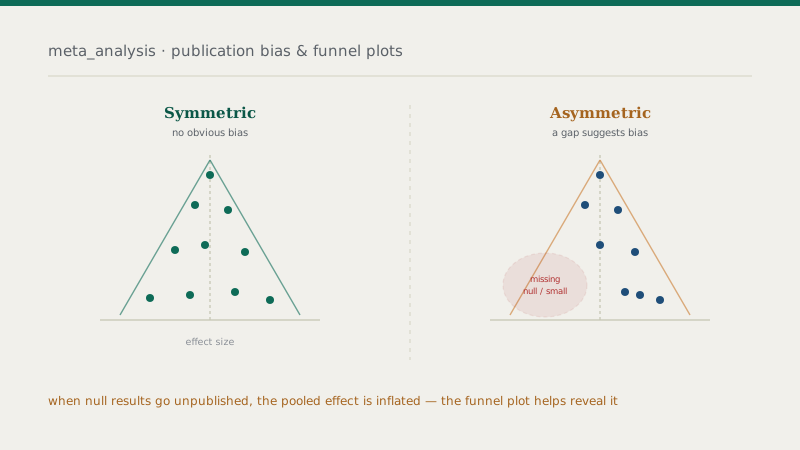
The primary visual tool for spotting publication bias is the funnel plot. It plots each study’s effect size against a measure of its precision (typically related to its sample size), with more precise studies toward the top and less precise ones toward the bottom. The logic is simple: large, precise studies should cluster tightly around the true effect, while small, imprecise studies should scatter more widely on either side of it. In the absence of bias, the result is a symmetric, inverted funnel shape—a broad base of scattered small studies narrowing to a tight peak of precise ones, spread evenly around the average.
Publication bias shows up as asymmetry. If small studies with null or unfavourable results are missing—because they went unpublished—then one corner of the funnel’s base is sparse or empty. A gap where the small, non-significant studies should be is the visual signature of publication bias: the funnel looks lopsided, with small studies present on the “significant” side but absent on the other. Inspecting a funnel plot for this asymmetry is a standard, expected step in reporting a meta-analysis.
A symmetric funnel is reassuring; an asymmetric one is a warning. But asymmetry is not proof of publication bias—genuine heterogeneity, or a real relationship between study size and effect, can produce it too. The funnel plot raises the question; it does not settle it.
Formal tests and beyond the funnel
Because reading a funnel plot by eye is subjective, formal statistical tests exist to assess funnel asymmetry more objectively—regression-based tests that quantify whether effect size is related to study precision. These give a p-value for asymmetry to accompany the visual impression. There are also methods that attempt to adjust for suspected bias—for instance, techniques that impute the studies apparently missing from a funnel and recompute the pooled estimate to show how much the bias might have mattered, or approaches that model the selection process directly.
These tools are useful but must be handled with care. Tests for funnel asymmetry have limited power when the number of studies is small, so a non-significant test does not confirm the absence of bias—especially in the small meta-analyses common in many fields. And adjustment methods rest on assumptions about why studies are missing that may not hold; they are best treated as sensitivity analyses that show how robust the conclusion is to possible bias, not as corrections that produce the “true” unbiased estimate. No statistical method can recover data that was never published; it can only reason about the shape of the gap.
The most important defence is prevention
As with several threats in evidence synthesis, the strongest response to publication bias is to design against it rather than to detect it after the fact. A thorough systematic review actively tries to counter the bias at the search stage: searching beyond the published literature for grey literature—unpublished studies, dissertations, conference papers, reports—and, increasingly, using trial and study registries to identify studies that were conducted but never published. Including this harder-to-find evidence directly counters the tilt toward positive published results, and it is one of the things that distinguishes a rigorous review from a convenient one.
The wider research ecosystem has developed structural remedies too—prospective registration of studies, and journals willing to publish null results—which reduce the bias at its source. For the meta-analyst, the practical implications are to search comprehensively and transparently, to assess for publication bias using funnel plots and formal tests, to run adjustment methods as sensitivity checks, and to report all of it honestly—including acknowledging when the number of studies is too small to assess bias reliably.
The bottom line
Publication bias—the tendency for significant results to be published and null ones to disappear—means the published literature over-represents positive findings, so a meta-analysis built only on it overstates the true effect. The funnel plot is the primary tool for detecting it: a symmetric inverted funnel suggests no obvious bias, while asymmetry—a gap where small null studies should be—is a warning sign, though not proof. Formal asymmetry tests and adjustment methods add rigour but have real limits, especially with few studies, and none can recover unpublished data. The most effective defence is a comprehensive search that includes grey literature and registries. Confront publication bias directly—search widely, test for it, treat adjustments as sensitivity analyses, and report honestly—and your synthesis stands on far firmer ground.
Frequently asked questions
Want a synthesis that confronts publication bias?
From comprehensive grey-literature and registry searches to funnel plots, asymmetry tests, and sensitivity analyses, our team can help you assess and report publication bias to a defensible standard.