Understanding Heterogeneity in Meta-Analysis
A meta-analysis produces a single pooled estimate—but that number only means something if the studies behind it are estimating the same effect. Heterogeneity is the measure of whether they are, and interpreting it correctly is what separates a meaningful synthesis from a misleading average.
The headline output of a meta-analysis is a single pooled effect—a diamond at the bottom of a forest plot that seems to settle the question. But that number carries a hidden condition: it is only meaningful if the studies it combines are estimating broadly the same underlying effect. When they are not—when the true effect genuinely varies from study to study—the pooled average can obscure far more than it reveals, blending together effects that point in different directions into one number that describes none of them. Heterogeneity is the concept that captures this, and understanding it is essential to reading, and conducting, a meta-analysis honestly.
This guide explains what heterogeneity is, how it is measured, what to do about it, and—most importantly—why it should be treated as a finding to explain rather than a nuisance to suppress. It deepens our guide to conducting a systematic review and meta-analysis and reflects the synthesis practice in our Meta-Analysis & Evidence Synthesis work.
What heterogeneity is
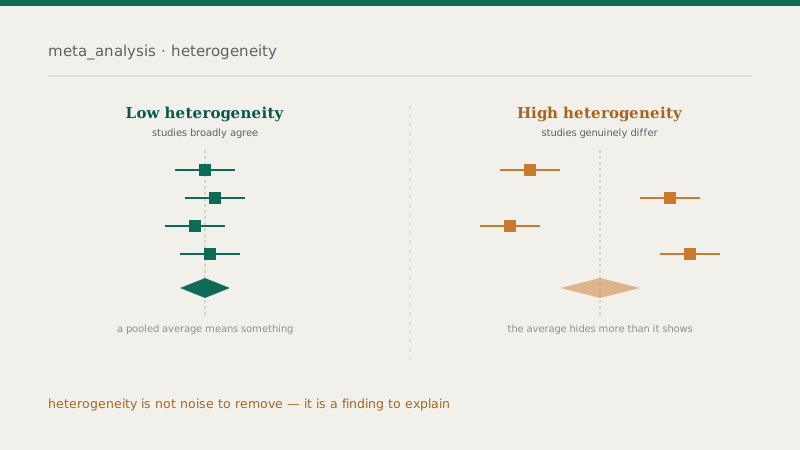
In a meta-analysis, the individual studies never produce identical results—their effect estimates always differ somewhat. Some of that difference is simply sampling error: each study is based on a finite sample, so its estimate wobbles around the truth by chance. Heterogeneity refers to the variation beyond what chance alone would produce—genuine differences in the true effect across studies. When heterogeneity is low, the studies are essentially all estimating the same effect and differ only by chance; when it is high, the true effect itself varies across the studies, for real reasons.
The distinction matters enormously for interpretation. Low heterogeneity means a pooled average is a sensible summary—there is one effect, and the meta-analysis pins it down precisely. High heterogeneity means there is no single effect to summarise; the studies are answering the same question in different contexts and getting genuinely different answers, and averaging them produces a number that may not apply to any real situation.
How heterogeneity is measured
Several statistics quantify heterogeneity, and they answer slightly different questions. Cochran’s Q is a test of whether any heterogeneity is present beyond chance—but it is sensitive to the number of studies, often failing to detect real heterogeneity when studies are few and flagging trivial heterogeneity when they are many, so a significant or non-significant Q should not be over-interpreted. I-squared is the most widely reported: it expresses the proportion of the total variation across studies that is due to real heterogeneity rather than chance, on a 0–100% scale, which makes it intuitive and comparable across analyses. Tau-squared estimates the actual variance of the true effects across studies, in the units of the effect size, which is what random-effects models use directly.
A common mistake is to lean on rules of thumb for I-squared—treating, say, 25%, 50%, and 75% as fixed “low/moderate/high” cut-offs. These are rough guides, not laws: the same I-squared can mean different things depending on the effect sizes and the number of studies, and I-squared says nothing about the direction or practical importance of the variation. The statistics should inform judgement, not replace it—the forest plot, showing where each study actually falls, is often more revealing than any single number.
Heterogeneity is a finding, not a flaw. High heterogeneity is not a sign the meta-analysis failed—it is telling you that the effect depends on something. The right response is to investigate what, not to hide it behind a pooled average.
Fixed-effect vs random-effects models
How you handle heterogeneity is bound up with the choice of model. A fixed-effect model assumes there is one true effect that every study is estimating, with differences due only to sampling error—appropriate only when heterogeneity is genuinely negligible. A random-effects model assumes the true effect varies across studies and estimates the average of that distribution of effects, explicitly accounting for the between-study variance (tau-squared). Because genuine heterogeneity is the norm rather than the exception in social-science, management, and most applied research—studies differ in populations, settings, measures, and design—the random-effects model is usually the more realistic and defensible default.
It is worth being clear about what each pooled estimate then means. Under a fixed-effect model, the pooled number is an estimate of the one common effect. Under a random-effects model, it is an estimate of the average effect across a distribution—which is a different, and often more honest, quantity when effects genuinely vary. Reporting the model choice and its rationale is part of a transparent meta-analysis.
Investigating and explaining heterogeneity
When substantial heterogeneity is present, the valuable work is explaining it. Two tools do this. Subgroup analysis splits the studies into groups—by population, setting, method, or design—and asks whether the effect differs systematically between them; finding that an intervention works in one context but not another is often more useful than the overall average. Meta-regression generalises this, modelling how the effect size varies with study-level characteristics treated as continuous or multiple moderators. Both turn heterogeneity from a problem into a source of insight: they identify what the effect depends on, which is frequently the most important contribution a synthesis can make.
These analyses come with cautions—they are observational comparisons across studies, vulnerable to confounding at the study level, and prone to false positives if many subgroups are tested—so they are best specified in advance and interpreted as exploratory unless pre-planned. But approached carefully, investigating heterogeneity is where a meta-analysis earns its keep, moving beyond “on average, this works” to “this works, for these cases, for these reasons.”
When not to pool at all
Sometimes the honest conclusion is that heterogeneity is so severe, or the studies so diverse, that no pooled estimate is meaningful. If the studies measure genuinely different things, in incomparable populations, using incompatible designs, forcing them into one number produces a meaningless average dressed up as a precise finding. In such cases a structured narrative synthesis, or a synthesis that groups only comparable studies, is more truthful than a single diamond. Recognising when not to pool is itself part of the analysis—and resisting the pull to compute a headline number simply because the software will is a mark of a careful reviewer.
The bottom line
Heterogeneity is the question at the heart of every meta-analysis: are these studies estimating the same effect, or different ones? Measure it with I-squared and tau-squared alongside the forest plot, but judge it—don’t apply cut-offs mechanically. Where it is genuine, prefer a random-effects model, investigate the sources through subgroup analysis or meta-regression, and be willing not to pool when the studies are simply too different. Treated this way, heterogeneity stops being an inconvenience and becomes what it should be: the most informative part of the synthesis, telling you not just whether an effect exists, but where, and why, it varies.
Frequently asked questions
Making sense of heterogeneity in your synthesis?
From choosing the right model to subgroup analysis and meta-regression, our team can help you interpret heterogeneity correctly—and know when a pooled estimate is, and isn’t, appropriate.